← Back to All Services

Service Overview

Whether you're working with RNA-seq, CRISPR screens, whole-genome sequencing, single-cell data, or any other sequencing technology, we provide expert bioinformatics analysis tailored to your specific research questions. Pay a small deposit to start, then pay based on your data size when you upload.

Best for: Any bioinformatic analysis - CRISPR, RNA-seq, WGS, single-cell, metagenomics, proteomics, structural modeling, or anything else. If it involves sequencing data, we can help.

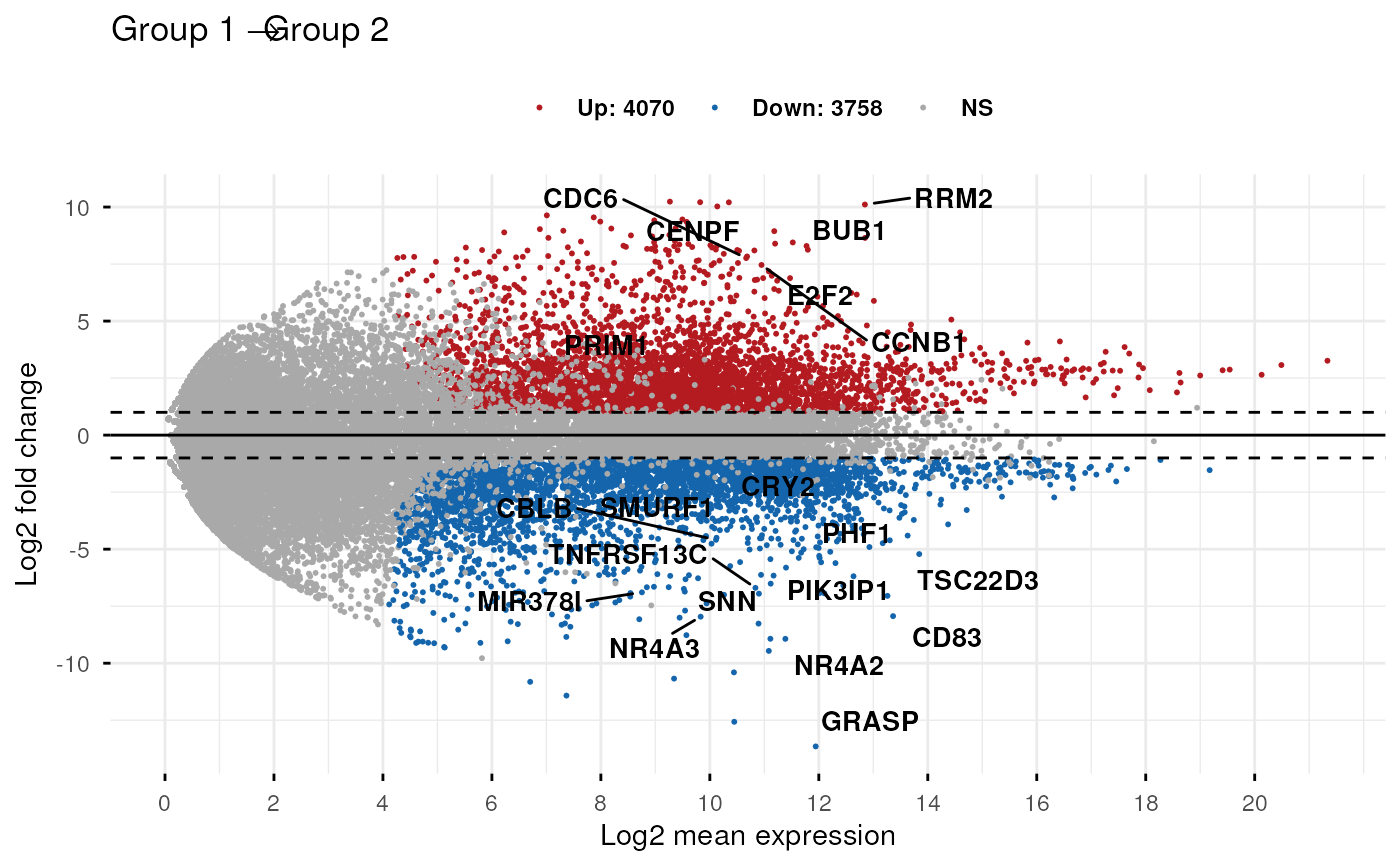
Example Deliverable: Differential Expression Analysis

Interactive MA plot - click the numbered markers or legend items to learn more

MA plot showing differential gene expression between two conditions
1
2
3
4
5
Up-regulated (4,070 genes)
Down-regulated (3,758 genes)
Not Significant

About This Figure

This MA plot visualizes differential gene expression between two experimental conditions. Each dot represents a single gene measured by RNA-sequencing. Click on the numbered markers or legend items above to explore different aspects of the plot.

Click any marker (1-5) or legend item to learn more

What this plot shows: Each dot represents a single gene measured by RNA-sequencing and compared between two experimental conditions (for example, a treated group vs. a control group). The horizontal axis ("Log2 mean expression") shows how strongly each gene is expressed on average across both conditions: points further to the right correspond to genes with higher overall RNA abundance, while points on the left are more weakly expressed genes.

Understanding fold change: The vertical axis ("Log2 fold change") shows how much each gene's expression changes between the two conditions. Values above zero indicate genes that are expressed more highly in the treated condition (up-regulated), and values below zero indicate genes that are more highly expressed in the control condition (down-regulated). Because the scale is log2-based, a value of +1 means "about 2-fold higher," +2 means "about 4-fold higher," -1 means "about 2-fold lower," and so on.

Color coding: Points are colored according to both the size of the change and its statistical significance. Red dots ("Up: 4070") are genes that are significantly up-regulated in the treated condition relative to control, after applying appropriate statistical tests and correcting for the large number of genes examined. Blue dots ("Down: 3758") are genes that are significantly down-regulated. Grey dots ("NS") represent genes whose expression differences are small and/or not statistically reliable.

Highlighted genes: Gene names printed next to selected points identify individual genes that show particularly strong or interesting changes in expression. For example, genes such as CDC6, BUB1, and RRM2 are highlighted among the up-regulated set, whereas genes like NR4A3, GRASP, and CD83 are highlighted among the down-regulated set. These labels direct attention to genes that may be especially relevant to the biological question being studied.

How to read it: Pick any dot and move vertically to see how much that gene changes between conditions (and in which direction), then move horizontally to see how highly the gene is expressed overall. Highly expressed genes with large positive or negative log2 fold changes (colored red or blue and far from the center line) represent the most robust and biologically compelling differences between the two conditions.

Project Types We Support

🧬
RNA-seq Analysis
Differential expression, pathway analysis
CRISPR Screens
Editing efficiency, indel analysis
🧬
Single-Cell RNA-seq
Cell clustering, trajectories
🔗
Multi-Omics
Integrate multiple data types
🦠
Metagenomics
Microbiome, virome analysis
📊
Any Other Analysis
WGS, ChIP-seq, ATAC-seq, etc.

How It Works

1
Pay Deposit
$9.99 to get started
2
Upload Data
Pay $0.99/GB at upload
3
We Analyze
Expert bioinformatics work
4
Get Results
Publication-ready deliverables

Data Types We Handle

We have experience with virtually any sequencing or omics data type:

RNA-seq Single-Cell RNA-seq CRISPR Screens Whole Genome Seq Exome Sequencing Amplicon Sequencing 16S/Metagenomics ChIP-seq ATAC-seq Long-Read (ONT/PacBio) Spatial Transcriptomics Proteomics

What's Included

  • Analysis tailored to your specific research questions
  • Publication-ready figures (PNG, PDF, SVG)
  • Comprehensive written report with interpretation
  • Methods section ready for your manuscript
  • All processed data files and tables
  • Code documentation for reproducibility
  • Results walkthrough call (optional)
  • Follow-up support after delivery